Cracking the Code — the commercial truth about your customers.
You know your revenue number. But do you know which customers are actually driving it — and which are quietly eroding it? Most businesses don’t. Cracking the Code does.
Your revenue number is hiding something.
Which three customers, if lost tomorrow, would genuinely hurt the business?
Is new revenue covering leakage from existing customers — or masking it?
Where is sales and marketing effort actually going — and is it going to the right places?
What would a 10% improvement in your existing customer base actually be worth?
Most businesses can’t answer these questions. Cracking the Code answers all of them.
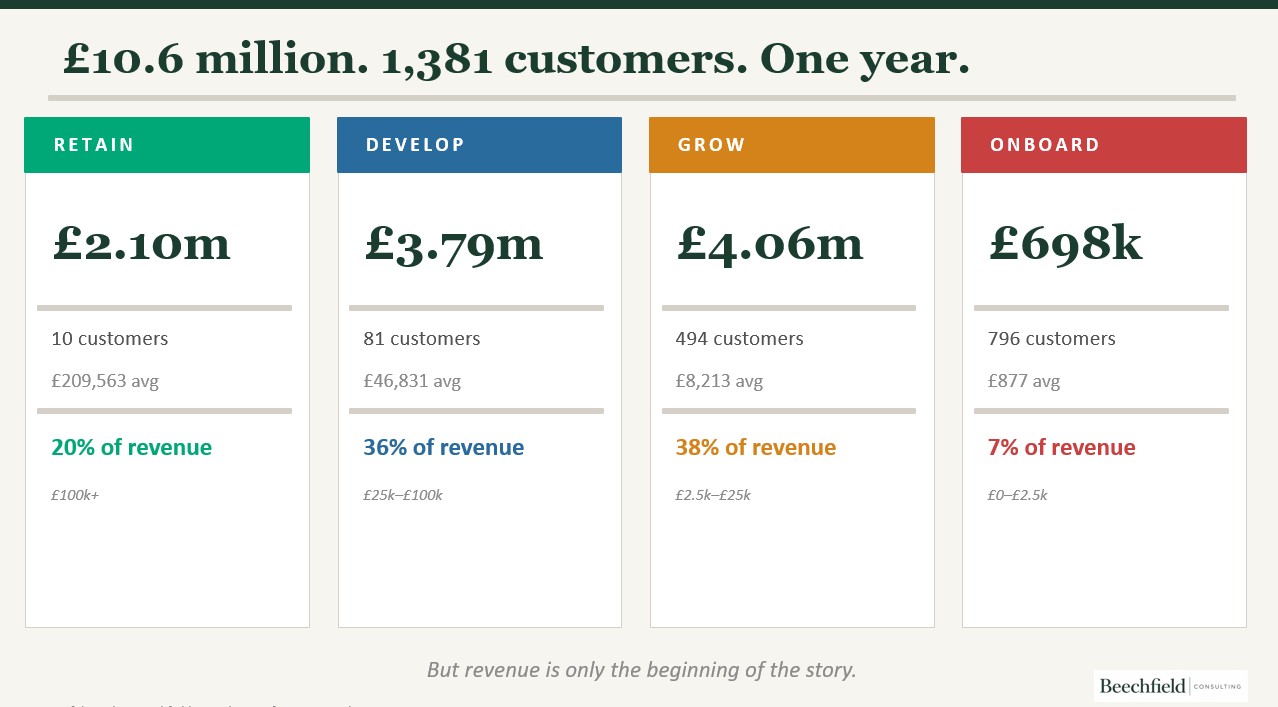
Every customer. Four tiers. One clear picture.
Cracking the Code segments your entire customer base into four commercial tiers. Each tier has a different strategy. Each tier tells a different story. NOTE: Tier sizes may change for your business.
Real output from a real engagement. Client details anonymised.
Five steps. Two working days. No IT project.
The process is designed to be straightforward to start and powerful in what it reveals.
Revenue moves. Most businesses never see it happen.
Customers migrate between tiers silently. Cracking the Code tracks that movement — and shows you what it means in pounds and customers.
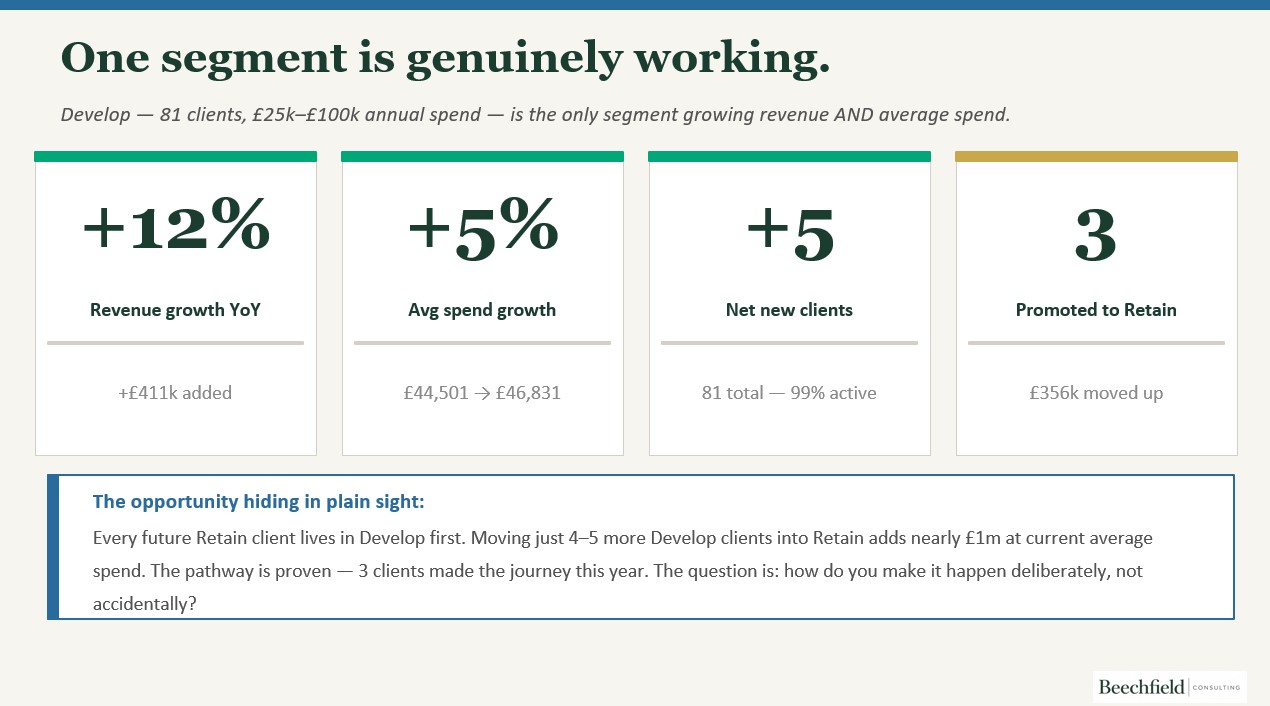
Real output from a real engagement. Client details anonymised.
What it reveals
A small number of customers representing a dangerously large share of revenue
New customer wins masking significant leakage from the existing base
Growth that looks healthy but is driven by a handful of relationships
Significant revenue sitting in underserved or unmanaged segments
Sales and marketing effort focused in the wrong places
What every engagement delivers
A structured view of the customer base by segment
Movement analysis — where customers are going and why it matters
Base, Inflow, Outflow and Net tracking for revenue and customer numbers
New, Lost and Lapsed customer analysis
A leadership session to interpret findings and align the team
Here’s what it found in real businesses.
Every business is different. The patterns are often surprisingly similar.
B2B Services Business — £7m turnover
“16 clients were generating 42% of total revenue. Nobody in the leadership team had quantified the concentration risk — or what losing just three of them would mean.”
“£779,000 of revenue had migrated downward through the customer tiers in a single year. Silently. The business thought it was growing. In the middle tier, it was going backwards.”
“A 10% recovery in average spend across all segments — with no new clients — would have generated an additional £721,000. The opportunity was already inside the business.”
None of this was visible before Cracking the Code. All of it was fixable.
Industrial B2B Business — £4m turnover
“The business believed its top 10 clients were its most valuable. Three of them were actually loss-making when true service cost was factored against revenue.”
“48% of new customers acquired in the previous 12 months had already lapsed. The sales team was filling a leaking bucket without knowing the bucket had a hole.”
“One customer segment — ignored because it looked small — had grown 37% year on year for three consecutive years. Nobody was actively managing it.”
The data was all there. It just hadn’t been put together in a way anyone could act on.
Three ways to work with Cracking the Code.
Takes approximately 2 working days. No large IT project. No long presentations. Just a clear view and a short action list.
Diagnostic
Full analysis and leadership session. Understand the shape of your customer base, where revenue is moving and what needs to happen next. Fixed-fee engagement.
Diagnostic + Strategy
Analysis, leadership session and a structured strategy workshop. Leaves the team aligned on priorities and a plan they can act on immediately.
Ongoing Advisory
Monthly or quarterly tracking of the customer base as part of a retained engagement. Keeps leadership focused and the data working continuously.
Any B2B business with customers and 24 months of data.
Equipment hire, construction and industrial businesses
Account-based revenue patterns drive commercial performance in these sectors. Cracking the Code was built for exactly this environment.
Professional services and distribution
Anywhere that customer relationships are the primary commercial asset. Where the cost of losing a client is high and often invisible until it’s happened.
MDs, commercial directors and sales leaders
Typically engaged by the people who need a clearer, more commercial picture of what the business is really doing — and are tired of operating on instinct.
It has never failed to produce insight that changes how leadership teams think about their business.
“Want to see what it reveals about your business?”
The first conversation costs nothing. I’ll tell you whether Cracking the Code is right for your business — and what we’d expect to find.